

Separating Signal and Noise
Not All Unrealized Losses Are Created Equal
- Commentary
- “Unrealized” losses in direct lending result from either market-driven spread widening or borrower-specific credit deterioration—distinguishing between the two is critical.
- Market-driven unrealized losses are often temporary (they create “noise” for investors), while borrower-specific losses are more likely to lead to permanent credit impairment.
- Close evaluation of borrower performance (interest coverage, non-accrual status, etc.) provides important context for interpreting unrealized losses.
Unrealized losses in direct lending are not all the same. Some reflect changes in market risk premiums, while others reflect higher risk of credit losses from deterioration in borrower fundamentals. This distinction is critical. Unrealized losses from market-driven factors can be volatile and often temporary, while borrower-driven losses are more likely to result in permanent credit impairment by becoming realized losses. For investors, the key is not whether unrealized losses occur, but what is driving them—and what that implies for long-term outcomes.
Short-Term Volatility vs. Long-Term Outcomes
Over the long run, direct lending returns are driven by two components: investment income and realized gains and losses. Together, these determine the permanent economic outcome of an investment.
In the short term, however, reported results can be affected by unrealized gains and losses under a fair value accounting framework, which requires investments to be marked to market based on current conditions. These valuation changes can add volatility to reported performance, even when underlying borrowers continue to perform as expected (see Exhibit 1).
Exhibit 1
Separating Temporary From Permanent Outcomes
Unrealized vs. Realized Volatility
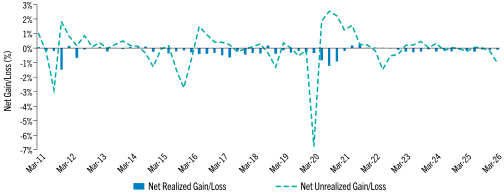
Source: Cliffwater Direct Lending Index. Data as of March 31, 2026.
A Framework for Unrealized Losses: Market vs. Borrower Factors
The primary driver of unrealized losses is changes in credit spreads. Credit spreads represent the additional return investors require for taking on credit risk. When the market requires a higher risk premium, the value of a loan generally declines, even though the contractual cash flows on the loan may be unchanged (see Exhibit 2).
While this explains the mechanics of the valuation change, spread movements can have different underlying drivers—and those drivers carry different implications:
- Market-driven factors: Changes in broader economic conditions and outlook can impact investor risk appetite, as can supply and demand for credit. These forces ebb and flow over time.
- Borrower-specific factors: Deterioration in a company’s financial performance (or outlook) can also lead to wider spreads. When we see deterioration in credit quality, we are more likely to see permanent losses.
Exhibit 2
For Each Action, an Equal and Opposite Reaction
Spreads and Loan Prices
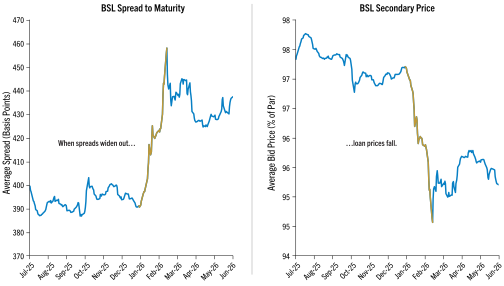
Sources: “BSL” is defined as broadly syndicated loans. BSL spread-to-maturity is based on the spread-to-maturity for LSTA leveraged loan index (all loans) from PitchBook. BSL secondary price is based on average bid price for LSTA leveraged loan index (all loans) from PitchBook. Data as of June 30, 2026.
Implications for Investors
So how can investors distinguish temporary market repricing from a more lasting credit issue?
A useful starting point for this analysis is borrower performance. Loans moving to non-accrual status or deterioration in core credit metrics—such as rising leverage, weakening interest coverage and tightening liquidity—are more indicative of underlying credit stress and carry a higher likelihood of becoming realized losses.
By contrast, unrealized losses on loans to borrowers that remain current on payments with stable credit metrics are more likely driven by broader market repricing. In these cases, periods of dislocation can create attractive opportunities as performing loans recover over time and new loans are made at higher interest rates.
Ultimately, the signal lies in borrower performance.
SIDEBAR
Loan Math: A Simplified Market-Driven Loan Markdown
To make this more concrete, consider a simplified example:
- A loan is originated at SOFR + 5.0%.
- The loan has approximately four years remaining.
- Market conditions shift, and comparable loans are now issued at SOFR + 5.5%.
An investor now requires an incremental 0.5% annual return to hold similar risk. Over a four-year period, that equates to roughly 2% of additional required return (0.5% × 4 years = 2%).
Because the loan’s contractual cash flows have not changed, the only way to deliver this higher return is through a lower purchase price.
In this example, the loan’s fair value declines from par (100%) to approximately 98%.
The key point is what did—and did not—change:
- Changed: The market spread and required return
- Unchanged: Borrower performance and expected cash flows
As a result, a manager holding this loan will record an unrealized loss due to spread widening, even though the borrower continues to perform as expected.
Exhibit 3
Loan Fair Value 101
Same Loan, Same Cash Flow -> Lower Price Driven by Higher Required Return
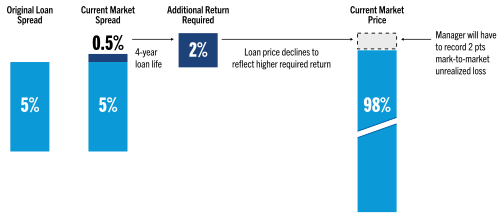
Note: Illustration not drawn to scale.
Source: Golub Capital internal analysis. For illustrative purposes only.
Disclaimer
In this document, the terms “Golub Capital” and “Firm” and, in responses to questions that ask about the management company, general partner, or variants thereof, the terms “Management Company” and “General Partner” refer, collectively, to the activities and operations of Golub Capital LLC, GC Advisors LLC (“GC Advisors”), GC OPAL Advisors LLC (“GC OPAL Advisors”, and together with GC Advisors, the “Registered Advisers”), and their respective affiliates or associated investment funds. Certain affiliated advisers are included as relying advisers (“Relying Advisers”) under GC OPAL Advisors’ umbrella registration, as described in its Form ADV. The terms “Investment Manager” or the “Advisers” may refer to GC Advisors, GC OPAL Advisors (collectively the “Registered Advisers”) or any of the Relying Advisers. For additional information about the Registered Advisers and the Relying Advisers, please refer to each of the Registered Advisers’ Form ADV Part 1 and 2A on file with the SEC. Certain references to Golub Capital relating to its investment management business may include activities other than the activities of the Advisers, or may include the activities of other Golub Capital affiliates in addition to the activities of the Advisers. This document may summarize certain terms of a potential investment for informational purposes only. In the case of conflict between this document and the organizational documents of any investment, the organizational documents shall govern.
Information is current as of the stated date and may change materially in the future. Golub Capital undertakes no duty to update any information herein. Golub Capital makes no representation or warranty, express or implied, as to the accuracy or completeness of the information herein.
Views expressed represent Golub Capital’s current internal viewpoints and are based on Golub Capital’s views of the current market environment, which is subject to change. Certain information contained in these materials discusses general market activity, industry or sector trends or other broad-based economic, market or political conditions and should not be construed as investment advice. There can be no assurance that any of the views or trends described herein will continue or will not reverse. Forecasts, estimates and certain information contained herein are based upon proprietary and other research and should not be interpreted as investment advice, as an offer or solicitation, nor as the purchase or sale of any financial instrument. Forecasts and estimates have certain inherent limitations, and unlike an actual performance record, do not reflect actual trading, liquidity constraints, fees, and/or other costs. In addition, references to future results should not be construed as an estimate or promise of results that a client portfolio may achieve. Past events and trends do not imply, predict or guarantee, and are not necessarily indicative of, future events or results. Private credit involves an investment in non-publicly traded securities which may be subject to illiquidity risk. Portfolios that invest in private credit may be leveraged and may engage in speculative investment practices that increase the risk of investment loss.
This presentation has been distributed for informational purposes only, and does not constitute investment advice or the offer to sell or a solicitation to buy any security. This presentation incorporates information provided by third-party sources that are believed to be reliable, but the information has not been verified independently by Golub Capital. Golub Capital makes no warranty or representation as to the accuracy or completeness of such third-party information. No part of this material may be reproduced in any form, or referred to in any other publication, without express written permission.
Past performance does not guarantee future results.
All information about the Firm contained in this document is presented as of July 2026, unless otherwise specified.
The Morningstar Indexes are the exclusive property of Morningstar, Inc. Morningstar, Inc., its affiliates and subsidiaries, its direct and indirect information providers and any other third party involved in, or related to, compiling, computing or creating any Morningstar Index (collectively, “Morningstar Parties”) do not guarantee the accuracy, completeness and/or timeliness of the Morningstar Indexes or any data included therein and shall have no liability for any errors, omissions, or interruptions therein. None of the Morningstar Parties make any representation or warranty, express or implied, as to the results to be obtained from the use of the Morningstar Indexes or any data included therein.
“Cliffwater,” “Cliffwater Direct Lending Index,” and “CDLI” are trademarks of Cliffwater LLC. The Cliffwater Direct Lending Indexes (the “Cliffwater Indexes”) and all information on the performance or characteristics thereof (“Cliffwater Index Data”) are owned exclusively by Cliffwater LLC, and are referenced herein under license. Neither Cliffwater nor any of its affiliates sponsor or endorse, or are affiliated with or otherwise connected to, Golub Capital, or any of its products or services. All Cliffwater Index Data is provided for informational purposes only, on an “as available” basis, without any warranty of any kind, whether express or implied. Cliffwater and its affiliates do not accept any liability whatsoever for any errors or omissions in the Cliffwater Indexes or Cliffwater Index Data, or arising from any use of the Cliffwater Indexes or Cliffwater Index Data, and no third party may rely on any Cliffwater Indexes or Cliffwater Index Data referenced in this report. No further distribution of Cliffwater Index Data is permitted without the express written consent of Cliffwater. Any reference to or use of the Cliffwater Index or Cliffwater Index Data is subject to the further notices and disclaimers set forth from time to time on Cliffwater’s website at https://www.cliffwaterdirectlendingindex.com/ disclosures.