Opposites Attract
Munis and Direct Lending as Portfolio Complements
- White Paper
- Municipal bonds and direct lending have reciprocal virtues when it comes to income yield, duration, inflation sensitivity and tax treatment, making the two assets natural complements or diversifiers in a total portfolio.
- Blending munis with direct lending may enable several key diversification benefits, potentially increasing portfolio income and total return while reducing volatility.
- By observing proper asset location guidance for the direct lending allocation, investors can mitigate the asset’s natural tax inefficiency to achieve superior after-tax returns.
Every part of the portfolio has a job to do. Stocks promise growth; bonds offer safety and yield—two characteristics often hard to find in a single package. For most of this century, traditional core bonds disappointed investors, causing them to search for higher and more stable income elsewhere, trading safety for yield. Direct lending, historically with low volatility and outsized yield, has emerged as an efficient way to solve for both. We compare the investment history of municipal bonds and middle market direct lending. Our findings suggest that whatever virtues each asset category has individually, investors may best harvest them through a blended allocation.
Opposites or Complements: Munis and Direct Lending
For taxable investors, municipal bonds—or “munis”—have long been a preferred core allocation. They offer an “anchor to windward” to offset equity volatility with greater tax efficiency than taxable fixed income.1 But over the last two decades, munis have delivered only modest income and total returns.
We take a close look at the performance of munis compared to other higher‑yielding debt alternatives—specifically, direct lending—and the comparison raises some questions. While generally considered “safe,” munis carry relatively high interest‑rate risk and only modest yield—characteristics that can leave the muni category particularly vulnerable to both rising rates and inflation.2
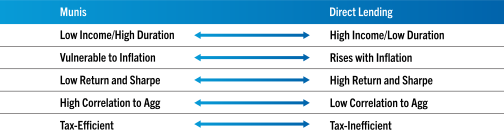
Direct lending has historically offered high income yield and robust total returns with little duration risk (as a floating‑rate investment), making it more resistant to inflation. The two also have had very low correlations with one another and sit at either end of a tax‑efficiency continuum (making direct lending a better fit for tax‑deferred accounts). These two debt offerings, contrary in so many ways, can be attractive portfolio complements, balancing each other’s virtues and liabilities.
Exhibit 1
Opposites Attract
A Marriage of Completeness: Munis and Direct Lending
Source: Golub Capital. For Illustrative Purposes Only.
Income and Duration: There’s a Middle Way
This paper explores a comprehensive array of investment characteristics among two asset categories: intermediate‑duration munis and middle market direct lending. We assess the results through the lens of pre‑tax returns, presuming direct lending is properly “located” in a tax‑deferred vehicle.3
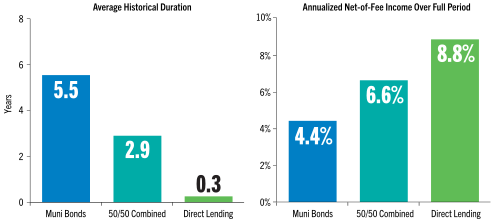
We focus first on several bond‑specific characteristics, particularly duration and yield.4 Over the full 21‑year period, munis have a duration of 5.5 years, in line with traditional core bonds (see Exhibit 2, left side, blue). At the other end of the duration spectrum is direct lending: It consists almost exclusively of floating‑rate instruments that reset quarterly in line with the Secured Overnight Financing Rate (SOFR) and have a duration of just several months (see Exhibit 2, left side, green).
The higher duration of munis translates to potential price appreciation (or depreciation) as interest rates move down (or up). This generates substantial return volatility. The near‑zero duration of direct lending means the “base rate” of the asset’s income yield rises on the back of rate increases, an important defensive characteristic relative to traditional fixed income. The impact of interest rate changes on private direct lending tends to be both less volatile and less binary in nature.5
The difference in income yield also stands out: Direct lending delivered annualized income averaging 8.8% net of fees over the last 21 years, double what munis have offered over that time frame (see Exhibit 2, right side, 4.4%).6
A balanced allocation across the two assets offers a middle ground. A 50/50 blend results in a 6.6% average annualized income yield, net of fees and a duration of just under three years, well below that of munis (see Exhibit 2, teal).7 The combination offers a more balanced exposure to both the liabilities and virtues associated with interest rate movements and income yield.
Exhibit 2
Higher Income, Lower Duration
Finding the Sweet Spot
Note: This analysis runs from Q1 2005–Q4 2025. Direct Lending is represented by the Cliffwater Direct Lending Index (CDLI); Muni Bonds are represented by the Bloomberg Intermediate Municipal Bond Index; 50/50 is represented as a blended version of the aforementioned indices. Annualized income represents the yearly income generated by an investment, after deducting fees.
All returns are construed on a net-of-fee basis. For further details, see Appendix.
Source: Bloomberg, CDLI. Data as of December 31, 2025.
Higher Highs, Softer Blows: A Total Returns Perspective
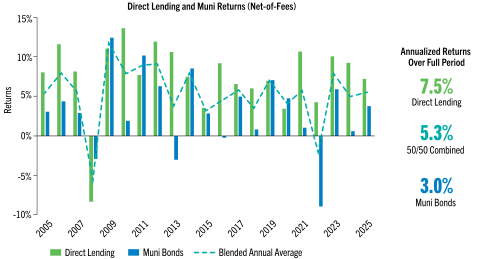
Turning from income yield and duration to total return reveals another contrast: Annualized net‑of‑fee returns for direct lending over the 21‑year period were 7.5%, more than twice the level of munis at 3.0% (see Exhibit 3). Annually and over time, direct lending has historically had both higher and more consistently positive returns. In some periods, exposure to it would have provided a timely counterweight for the overall portfolio, buoying total returns when muni performance was low or negative.8
Several performance characteristics stand out from the analysis (see Exhibit 3):
- Direct lending returns outpaced munis in 15 of 21 full calendar years.
- Direct lending outperformed on average by 7 percentage points; in the six years when munis led, they did so, on average, by almost 2 percentage points.
- Munis had negative returns in four calendar years; direct lending experienced just one down year (2008).
- In the three years when munis were negative but direct lending positive, direct lending provided a timely and substantial counterweight, with higher‑than‑usual positive performance (8 percentage points).
- In only one year did munis and direct lending both experience simultaneous negative returns (2008).
A blended 50/50 allocation delivered annualized performance of 5.3% over the full period (in teal)—higher than munis alone with less downside risk and greater consistency over time.
Exhibit 3
Higher, Tighter, Smoother
A Blended Allocation Offers Higher, More Consistent Total Returns
Note: This analysis runs from Q1 2005–Q4 2025. Direct Lending is represented by the Cliffwater Direct Lending Index; Muni Bonds are represented by the Bloomberg Intermediate Municipal Bond Index; 50/50 represents a blended version of the aforementioned indices. All returns are construed on a net-of-fee basis. For further details, see Appendix.
Source: Bloomberg, CDLI. Data as of December 31, 2025.
The Alchemy of Complementary Assets
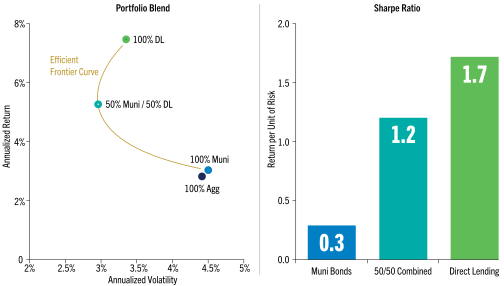
The appeal of combining low‑correlated assets is a basic principle of portfolio construction. Over the past 21 years, munis and direct lending had a correlation of just 0.1. The alchemy of diversification suggests a mix of munis and direct lending would produce a single composite whole with more attractive risk and return characteristics than the two assets would individually.
The resulting portfolio blend delivers higher total returns—a more than 200 bps improvement in performance—and lower volatility than munis (see Exhibit 4, left side, teal). A classic efficient frontier capturing risk and return together illustrates the greater efficiency of the combined allocation: The 50/50 blend results in a Sharpe Ratio of 1.2 vs. 0.3 for munis alone (see Exhibit 4, right side, teal).
Exhibit 4
Better Together
Seeking Frontiers of Greater Efficiency
Note: This analysis runs from Q1 2005–Q4 2025. Direct Lending is represented by the Cliffwater Direct Lending Index; Muni Bonds are represented by the Bloomberg Intermediate Municipal Bond Index; 50/50 represents a blended version of the aforementioned indices. Agg is represented by the Bloomberg U.S. Aggregate Bond Index.
Sharpe ratio measures risk-adjusted return by comparing an investment’s excess return over the risk-free rate to its volatility. All results are construed on a net-of-fee basis. For further details, see Appendix.
Source: Bloomberg, CDLI. Data as of December 31, 2025.
Extending the Tax-Efficiency Frontier
We close by moving from optimizing risk and return to an efficient frontier of a different kind—tax efficiency.
Over the 21‑year period under review, munis stand out as arguably the most tax‑efficient asset available to investors, with a “tax drag” of almost zero (see Exhibit 5, light‑blue dot). Meanwhile, direct lending suffers relative tax headwinds on par with taxable core bonds, reaching just under 50% (see green and dark‑blue dots).
But with the aid of tax‑deferred portfolios and smart asset location (see teal dot), the combination of munis and direct lending could deliver many of the benefits discussed already (higher income and total return, as well as lower duration and less vulnerability to inflation) with less erosion (under 15%) from taxes.
Exhibit 4
A Tax-Efficient Blend
Mitigating the Tax Headwinds of Direct Lending
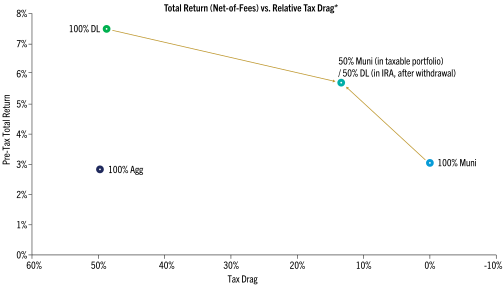
Note: This analysis runs from Q1 2005–Q4 2025. Direct Lending is represented by the Cliffwater Direct Lending Index; Muni Bonds are represented by the Bloomberg Intermediate Municipal Bond Index; Agg is represented by the Bloomberg U.S. Aggregate Bond Index. For the 50/50 portfolio, the DL allocation is held in a tax-deferred account and liquidated at the end of the 21-year period at a 20% implied federal tax rate.
*Relative Tax Drag is defined as the ratio of absolute tax drag to pre-tax returns, representing the reduction in an investment’s return due to taxes on income distributions and realized gains. All returns are construed on a net-of-fee basis. For further details, see Appendix.
Source: Bloomberg, CDLI. Data as of December 31, 2025.
1. Munis face no federal tax and, in some cases, no state tax either.
2. As measured by the Bloomberg U.S. Aggregate Index.
3. This analysis runs from Q1 2005–Q4 2025. The indices include the Bloomberg Intermediate Municipal Bond Index and the CDLI. The fees applied on munis (47 bps) represent the average asset‑weighted fees on intermediate‑duration munis based on the Investment Company Institute (ICI) 2025 Handbook; the fees applied to the Cliffwater Index (193 bps) are based on the August 19, 2024, analysis by Cliffwater regarding their recommended fee calculations. The CDLI is based on gross‑of‑fee returns and includes no leverage. For net‑of‑tax results, use a capital gains tax rate of 23.8% and the highest category of ordinary income tax of 40.8%. Assets are modeled with a 5% quarterly turnover rate for the purposes of calculating capital gains taxes.
4. In terms of credit risk, we acknowledge that munis tend to be default‑remote, with a default rate over the last 10 years of under 0.1%, as per Moody’s U.S. Public Finance Report, U.S. Municipal Bond Defaults and Recoveries, 1970–2022. This compares to a direct lending credit loss rate over the same period of 1.04%. That said, muni defaults, while rare, can affect a large dollar volume of debt when they do occur, as recent examples in Detroit and Puerto Rico make clear. Interestingly, speculative‑grade municipal default rates were higher (0.6%) in this period and, during periods of stress, often exceeded those of speculative‑grade corporates.
5. For a long‑term analysis of interest rate movements and the impact on both core bonds and direct lending, see “Cut and Run: Direct Lending and Interest Rates,” Golub Capital Insights.
6. The average annual tax‑equivalent yield of intermediate‑duration municipal bonds over the 21‑year period was 7.4%, using the 40.8% ordinary income tax rate.
7. The 50/50 blended allocation assumes quarterly rebalancing.
8. Looking at a post-tax or tax-equivalent analysis would show substantially different results.
Appendix
The analysis runs from Q1 2005–Q4 2025, a full 21 years. The indices include the Bloomberg Intermediate Municipal Bond Index, Bloomberg U.S. Aggregate Index, S&P 500 for equities and the Cliffwater Direct Lending Index (CDLI). We pull total return, price return and income return for each. For net‑of‑fee analysis, the fees applied on municipal bonds (47 bps), U.S. Agg (37 bps) and equities (42 bps) represent the average asset‑weighted fees on each asset class based on the Investment Company Institute 2025 Handbook; the fees applied to the Cliffwater Index (193 bps) are based on the August 19, 2024, analysis by Cliffwater regarding their recommended fee calculations. The CDLI is gross of fees and includes no leverage. For net tax results, we use capital gains tax of 23.8% and the highest category of ordinary income tax of 40.8%. Assets are modeled with a 5% quarterly turnover rate for the purpose of calculating capital gains taxes. We calculate and pay taxes on a quarterly basis, and we assume that tax liability is paid in the quarter it has occurred. Bonds and CDLI income are taxed at the federal top marginal ordinary income + NII rate of 40.8%, and equities income is taxed as qualified dividends + NII rate of 23.8%. Capital gains/losses arising from turnover or rebalancing are assumed to be long‑term. Any unused capital loss is carried forward for future periods. Capital gains are taxed at the top marginal rate + NII of 23.8%. Cash arising from turnover and income is used to pay taxes at the end of the quarter, and the remaining amount is redeployed at the beginning of the next quarter in the target portfolio weights. Retirement accounts follow the same assumptions as taxable accounts without taxes, which is equivalent to weighted pre‑tax net‑of‑fees asset returns in a given quarter. When we compare retirement accounts to taxable accounts to capture the effect of the taxes at withdrawal, we withdraw the full amount and tax it at a 20% rate (presuming a lower effective tax rate in retirement). When we show allocations of 50% taxable/50% retirement, we do not rebalance between retirement and taxable accounts. We purchase 50% in the beginning in each account and let the two accounts proceed independently, subject to their own internal allocations; therefore, actual allocation will tend to drift slightly over the period. CDLI over the period has produced both income and net capital losses; therefore, total return is lower than income return. We subtract fees of 1.93% from the income return. In our model, the net‑of‑fee annualized income return is approximately 8.8%, annualized price return is ‑1.3% and total pre‑tax return is 7.5%. We pay taxes on 8.8% at a 40.8% ordinary income rate, which amounts to roughly 3.6% in taxes and represents the absolute tax drag on direct lending. To find the relative tax drag, we divide the absolute tax drag by pre‑tax returns, resulting in a 48% relative tax drag, higher than the 40.8% ordinary income rate used throughout. Direct lending over the period suffers a 1.3% loss on price return, but realized capital losses do not offset ordinary income.
Disclaimer
In this document, the terms “Golub Capital” and “Firm” (and, in responses to questions that ask about the management company, general partner or variants thereof, the terms “Management Company” and “General Partner”) refer, collectively, to the activities and operations of Golub Capital LLC, GC Advisors LLC (“GC Advisors”), GC OPAL Advisors LLC (“GC OPAL Advisors”) and their respective affiliates or associated investment funds. A number of investment advisers, such as GC Investment Management LLC (“GC Investment Management”), Golub Capital Liquid Credit Advisors, LLC (Management Series) and OPAL BSL LLC (Management Series) (collectively, the “Relying Advisers”) are registered in reliance upon GC OPAL Advisors’ registration. The terms “Investment Manager” or the “Advisers” may refer to GC Advisors, GC OPAL Advisors (collectively the “Registered Advisers”) or any of the Relying Advisers. For additional information about the Registered Advisers and the Relying Advisers, please refer to each of the Registered Advisers’ Form ADV Part 1 and 2A on file with the SEC. Certain references to Golub Capital relating to its investment management business may include activities other than the activities of the Advisers or may include the activities of other Golub Capital affiliates in addition to the activities of the Advisers. This document may summarize certain terms of a potential investment for informational purposes only. In the case of conflict between this document and the organizational documents of any investment, the organizational documents shall govern.
Information is current as of the stated date and may change materially in the future. Golub Capital undertakes no duty to update any information herein. Golub Capital makes no representation or warranty, express or implied, as to the accuracy or completeness of the information herein.
Views expressed represent Golub Capital’s current internal viewpoints and are based on Golub Capital’s views of the current market environment, which is subject to change. Certain information contained in these materials discusses general market activity, industry or sector trends or other broad-based economic, market or political conditions and should not be construed as investment advice. There can be no assurance that any of the views or trends described herein will continue or will not reverse. Forecasts, estimates and certain information contained herein are based upon proprietary and other research and should not be interpreted as investment advice, as an offer or solicitation, nor as the purchase or sale of any financial instrument. Forecasts and estimates have certain inherent limitations, and unlike an actual performance record, do not reflect actual trading, liquidity constraints, fees, and/or other costs. In addition, references to future results should not be construed as an estimate or promise of results that a client portfolio may achieve. Past events and trends do not imply, predict or guarantee, and are not necessarily indicative of, future events or results. Private credit involves an investment in non-publicly traded securities which may be subject to illiquidity risk. Portfolios that invest in private credit may be leveraged and may engage in speculative investment practices that increase the risk of investment loss.
This presentation has been distributed for informational purposes only, and does not constitute investment advice or the offer to sell or a solicitation to buy any security. This presentation incorporates information provided by third-party sources that are believed to be reliable, but the information has not been verified independently by Golub Capital. Golub Capital makes no warranty or representation as to the accuracy or completeness of such third-party information. No part of this material may be reproduced in any form, or referred to in any other publication, without express written permission.
Past performance does not guarantee future results.
All information about the Firm contained in this document is presented as of July 2026, unless otherwise specified.
The Morningstar Indexes are the exclusive property of Morningstar, Inc. Morningstar, Inc., its affiliates and subsidiaries, its direct and indirect information providers and any other third party involved in, or related to, compiling, computing or creating any Morningstar Index (collectively, “Morningstar Parties”) do not guarantee the accuracy, completeness and/or timeliness of the Morningstar Indexes or any data included therein and shall have no liability for any errors, omissions, or interruptions therein. None of the Morningstar Parties make any representation or warranty, express or implied, as to the results to be obtained from the use of the Morningstar Indexes or any data included therein.
“Cliffwater,” “Cliffwater Direct Lending Index,” and “CDLI” are trademarks of Cliffwater LLC. The Cliffwater Direct Lending Indexes (the “Cliffwater Indexes”) and all information on the performance or characteristics thereof (“Cliffwater Index Data”) are owned exclusively by Cliffwater LLC and are referenced herein under license. Neither Cliffwater nor any of its affiliates sponsor or endorse, or are affiliated with or otherwise connected to, Golub Capital, or any of its products or services. All Cliffwater Index Data is provided for informational purposes only, on an “as available” basis, without any warranty of any kind, whether express or implied. Cliffwater and its affiliates do not accept any liability whatsoever for any errors or omissions in the Cliffwater Indexes or Cliffwater Index Data, or arising from any use of the Cliffwater Indexes or Cliffwater Index Data, and no third party may rely on any Cliffwater Indexes or Cliffwater Index Data referenced in this report. No further distribution of Cliffwater Index Data is permitted without the express written consent of Cliffwater. Any reference to or use of the Cliffwater Index or Cliffwater Index Data is subject to the further notices and disclaimers set forth from time to time on Cliffwater’s website at Cliffwater Direct Lending Index disclosures.