

From Allocation to Location
Positioning Direct Lending in the Tax-Aware Portfolio
- Commentary
- Traditional asset location rules focused solely on asset-level tax efficiency can be misleading; incorporating an asset’s return potential and other characteristics can lead to more optimal portfolio decisions.
- Direct lending’s combination of consistent, equity-like returns and bond-like tax inefficiency makes it particularly well-suited for tax-deferred accounts.
- A holistic, tax-aware portfolio that combines thoughtful asset allocation and asset location can materially improve total returns while still mitigating undue tax headwinds.
The traditional rule of thumb for asset location—prioritizing certain investments for inclusion in tax deferred accounts—warrants a review. Conventional guidance focuses on sheltering assets with the most punitive taxation. But the compounding effect from tax-deferred growth is greater when the sheltered asset is higher-returning, regardless of its relative tax inefficiency. We develop a framework that accounts for both considerations. Our analysis suggests that assets that combine equity-like returns with bond-like tax headwinds, such as direct lending, may be optimal candidates for tax-deferred accounts.
Re-Thinking the Rule Book for Tax “Alpha”
Tax “alpha” can be both more robust and less variable than investment alpha, and smart asset location is an effective way to embed such tax-based tailwinds in the portfolio. But longstanding rules of thumb on asset location may actually get in the way of optimal outcomes.
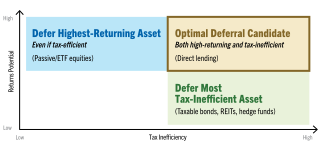
Sheltering traditional fixed income has long seemed the obvious choice since the bulk of its return comes in the form of income that is taxed at (higher) ordinary rates (see Exhibit 1, green box). Stocks, on the other hand, have higher expected returns than bonds, but their dominant driver is capital appreciation, with (lower) capital gains tax treatment (see Exhibit 1, blue box). Bonds face a higher relative tax burden, while stocks compound faster due to their superior returns. Which of the two should an investor prioritize for tax-deferred accounts?
Academic and practitioner studies struggle to provide a clear answer. The calculus hinges on time horizon, return assumptions, tax rates and other factors that are difficult or impossible to predict. But there’s an easier solution: The ideal asset to shelter would have both high equity-like returns and punitive bond-like taxation, where deferral enables less tax drag and higher compounding. We believe middle market direct lending best fits that description (see Exhibit 1, gold box).
Exhibit 1
Location, Location
Rethinking Asset Location Guidance
Source: Golub Capital. For illustrative purposes only.
Winning the Tax Drag Race
Tax is a drag on most individual investor portfolios. But there’s a relatively clear framework for navigating its headwinds.
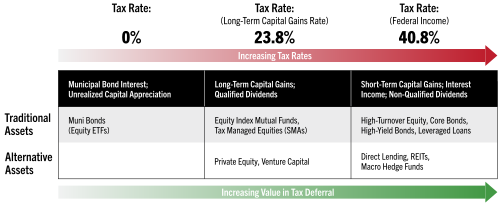
Marginal tax rates tend to be highest for assets whose returns are derived primarily from non-qualified interest income, which is taxed at (higher) ordinary income rates (currently 40.8%). This includes most bond portfolios, including core bonds, corporate debt, emerging market debt and mortgage bonds (and, by extension, REITs).1 It also comprises leveraged loans and private direct lending, which are floating-rate in nature and see little capital appreciation from duration-related changes in rates—rendering their return stream largely income-based (see Exhibit 2).
Similarly, short-term capital gains tax rates, which are generally in line with the highest ordinary income levies, are incurred by portfolios with high-turnover strategies, such as actively managed equity and trading-heavy hedge funds.
Next in order of tax inefficiency are assets whose returns are derived primarily from long-term capital appreciation and qualified dividends. These typically benefit from more favorable long-term capital gains tax treatment (currently 23.8%). Examples here include tax-managed equities, often delivered in separately managed accounts, and passive long-only equity mutual funds or ETFs. Several private market investments belong in this category as well: Both venture capital and private equity tend to produce mostly capital gains, realized over long horizons, and little income.
That leaves munis in a category of their own, incurring no federal income tax and, in some cases, no state tax either. Passive equity ETFs benefit further from the “heartbeat” mechanism embedded within the exchange-traded structure, which enables equity ETFs to sidestep most capital gains charges altogether. For taxable accounts, equity ETFs and muni bonds together constitute arguably the most efficient constituents of an individual investor portfolio, often split 60/40.
But when it comes to tax-deferred accounts, conventional wisdom has been to prioritize assets based solely on asset-level tax inefficiency. We believe the calculus behind tax deferral should not be limited to a single metric based on tax. Decisions on optimal asset location should also include an investment’s potential for higher growth via compounding.
Exhibit 2
It’s a Drag
Tax Headwinds by Asset Class
Note: Tax rates shown reflect the highest applicable federal long-term capital gains and ordinary income rates as of Q4 2025. Despite modest shifts over the last 21 years (Q1 2005–Q4 2025), tax rates have remained broadly at the levels indicated here, especially for high-income taxpayers. Long-term capital gains rates hovered at 20% over the last several decades, except for the period 2003−2013, when they dipped to 15%. A 3.8% surcharge related to the Affordable Care Act was initiated in 2012. Top ordinary income rates have oscillated just around the 40% level since the early 1990s.
Source: Golub Capital internal analysis. Data as of December 31, 2025. For illustrative purposes only.
It’s About Time (and Returns): The Constituents of Compounding
After diversification, compounding is the second most important “free lunch” in investing. It’s mostly about time, hence the generic admonition to “start early.” But there are other elements that contribute to compounding’s money making magic.
Investments with higher returns naturally compound at a faster rate than lower-returning assets. Removing annual taxation is another powerful tailwind, allowing capital to grow free of tax drag, at least during the deferral period.
Direct lending, with a long history of equity-like returns, can be a champion compounder. In a tax-deferred structure, its steady income can be reinvested continuously without tax drag, creating a compounding engine suitable for a long-horizon retirement portfolio.
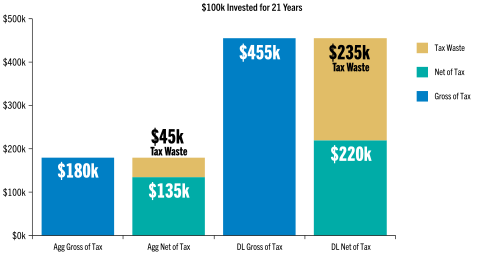
Since tax-efficient munis have no need for tax deferral, we limit our analysis to traditional core bonds and direct lending.2 We measure returns over an extended 21-year period (appropriate for retirement accounts) to assess terminal wealth and the magnitude of returns lost to federal taxes, which we refer to as investment “waste.”
We put $100k into both assets, reinvest the proceeds and watch them grow, tax-free, over the period (see Exhibit 3). On a pre-tax and net-of-fee basis, direct lending delivers roughly 2.5x the growth of core bonds ($455k vs. $180k). More striking is the tax impact: Direct lending loses over 5x as much to taxes ($235k vs. $45k).3 But even on an after-tax basis (presuming withdrawal at the highest ordinary income tax rate), direct lending delivers a wealth outcome about 1.5x greater than core bonds ($220k vs. $135k). Direct lending is the superior compounder and, as a result, suffers greater erosion from taxes. It’s the asset that most deserves its location in a tax-deferred setting.
Exhibit 3
Waste Not
Strong and Steady Wins the Tax-Drag Race
Note: This analysis runs from Q1 2005−Q4 2025. Direct Lending is represented by the Cliffwater Direct Lending Index; Agg is represented by the Bloomberg US Aggregate Bond Index. For the gross of tax analysis, we grow both assets tax-free for the 21-year duration of the analysis. To illustrate “tax waste,” we liquidate both assets in year 21, applying the highest ordinary federal tax rate (40.8%). All returns are construed on a net-of-fee basis. For further details, see Appendix.
Source: Bloomberg, CDLI. Data as of December 31, 2025.
Accounting for Tax-Headwinds: Optimizing Asset Location
What is the optimal asset “location” for direct lending in a tax-aware portfolio? The answer is straightforward: tax-deferred accounts such as IRAs or insurance-dedicated funds.
But let’s work through the argument analytically. We examine the return history of core bonds, munis and direct lending (see Exhibit 4), applying both relative and, in this case, absolute measures of tax drag—the difference between pre-tax and after-tax returns.4
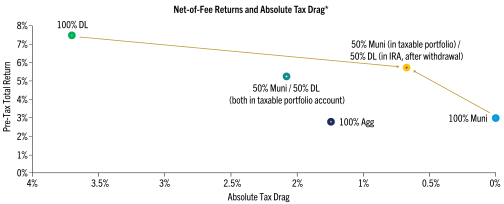
If held in a taxable account, direct lending suffers a nearly 50% return haircut due to taxes, about the same in percentage terms that core bonds experience.5 But in absolute terms, this represents a sizable 3.6 percentage-point erosion from the asset’s 7.5% pre-tax, net-of-fee return (see Exhibit 4, green dot). Compare that to a pure muni allocation, with zero tax drag, and a pre-tax net-of-fee return of 3% (see light-blue dot).6
When we blend the two assets together in a single allocation (in a taxable account), the absolute tax drag declines by roughly 1.5 percentage points from just over 3.5% to approximately 2% (see teal dot). This boosts the pre-tax return of standalone munis from 3% annually to a blended return of over 5%.
Next, we include a tax-deferred account option such as an IRA. With direct lending in the tax-deferred account, it is spared further wind shear from taxes during the investment period (see gold dot). Absolute tax drag for the 50/50 Muni/DL portfolio— with DL now properly “located”—declines from around 2% to just over 0.5%. The annualized after-tax return of the blended and tax-aware allocation (upon withdrawal) rises to nearly 6%, almost double what the muni allocation alone provides, and not far from the 7.5% pre-tax net-of-fee return for direct lending on its own.
Exhibit 4
From Allocation to Location
Constructing Tax Alpha in the Portfolio
Note: This analysis runs from Q1 2005–Q4 2025. DL is represented by the Cliffwater Direct Lending Index; Muni Bonds are represented by the Bloomberg Intermediate Municipal Bond Index; Agg is represented by the Bloomberg US Aggregate Bond Index. For DL (in IRA), the asset grows for the 21-year duration of the analysis in a tax-deferred account and is liquidated in year 21 with an implied 20% federal tax rate.
*Tax drag represents the reduction in an investment’s return due to taxes on income distributions and realized gains.
Source: Bloomberg, CDLI. Data as of December 31, 2025.
The Holistic Tax-Aware Portfolio: Allocation and Location Together
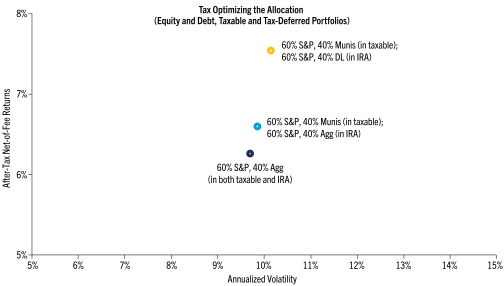
Finally, let’s move from a discussion of the bond portfolio in isolation to a comprehensive client allocation—one that includes equities and bonds, in both taxable and tax-deferred accounts. For simplicity’s sake and for comparison purposes, we assume the investor maintains a 60% equity and 40% bond portfolio and keeps that 60/40 allocation consistent across both taxable and tax-advantaged accounts.7
First, we look at a basic (and not particularly tax-aware) allocation, blending equities and taxable core bonds across both types of accounts, taxable and tax-deferred. Its net-of fee and after-tax return is just about 6.3% annually, with 9.7% volatility (see Exhibit 5, dark-blue dot).
Next, we look at a more tax-aware portfolio, using munis in the taxable account (minimizing tax drag there) and placing the taxable core bond allocation in the tax-advantaged IRA (see light-blue dot). The investor scores an easy gain in returns of about 30 bps annually, to 6.6%.
Now consider a tax-aware allocation that also includes higher-returning direct lending. Tax-efficient munis occupy the taxable portfolio, and tax-inefficient direct lending is sheltered in the tax-deferred account (see gold dot). By eliminating the tax shear on direct lending, after-tax net-of-fee returns for the combined portfolio reach 7.5%, about 120 bps higher than the core bond allocation, with just a modest increase in risk.
An allocation to direct lending can take many forms. But positioning the asset in a tax-aware portfolio requires special considerations. For optimal client outcomes, we believe smart asset location should inform the inclusion of direct lending in the portfolio.
Exhibit 5
Great Taste and Less Filling
A Holistic, Tax-Aware Portfolio with Direct Lending
Note: This analysis runs from Q1 2005–Q4 2025. Direct Lending is represented by the Cliffwater Direct Lending Index; Muni Bonds are represented by the Bloomberg Intermediate Municipal Bond Index; Agg is represented by the Bloomberg US Aggregate Bond Index. Equities are represented by the S&P 500. All returns are construed on a net-of-fee basis. For further details, see appendix. For DL in IRA, the asset grows for the 21-year duration of the analysis in a tax-deferred account and is liquidated in year 21 with an implied 20% federal tax rate.
Source: Bloomberg, S&P, CDLI. Data as of December 31, 2025.
1. Other asset classes that face the stiffest tax headwinds include REITs (real estate investment trusts), which are also heavily reliant on non-qualified income as generally the largest component of their returns.
2. We exclude equities in this analysis because of their inherent tax efficiency—especially in ETF form—and we maintain a 60/40 equity/bond allocation in both taxable and tax-deferred accounts, per common advisory practice.
3. To capture capital gains taxes, we assume 5% quarterly turnover.
4. The period of this analysis runs from Q1 2005–Q4 2025. The indices include the Bloomberg Intermediate Municipal Bond Index and the Cliffwater Direct Lending Index (CDLI). The fees applied on municipal bonds (47 bps) represent the average asset-weighted fees on intermediate-duration municipal bonds based on the Investment Company Institute (ICI) 2025 Handbook; fees to Agg Bonds are 37 bps and 42 bps for equities; and the fees applied to the Cliffwater Index (193 bps) are based on the August 19, 2024, analysis by Cliffwater regarding their recommended fee calculations. The CDLI is based on gross-of-fee returns and includes no leverage. For net-of-tax results, we use a capital gains tax of 23.8% and the highest category of ordinary income tax of 40.8%. Assets are modeled with a 5% quarterly turnover rate for the purposes of calculating capital gains taxes. Portfolios of blended assets assume quarterly rebalancing. We do not rebalance between retirement and taxable accounts but rebalance within respective accounts when applicable. IRA is assumed to be liquidated at the end of the analysis, with a 20% tax rate, to estimate full after-tax impact.
5. Our analysis shows very simliar tax headwinds for other taxable bond categories, including investment-grade corporate bonds, high-yield bonds and, of course, public broadly syndicated loans. A natural question to consider is why the tax headwind (of nearly 50%) is higher than the applicable 40.8% ordinary rate. The CDLI, over the period studied, has produced income and net capital losses; therefore, total return is lower than income. In our model, net-of-fees annualized income is ~8.8%, while annualized price return is ~1.3%, and total pre-tax returns are 7.5%. We pay taxes on the 8.8% income return at the 40.8% income rate (roughly 3.6% in taxes). Then we lose 1.3% on price return. Realized capital losses do not offset ordinary income, so if the investor holds only CDLI, there are no gains to offset. Even if there were realized gains, they would only soften the blow modestly to ~1.1%. It’s still a net loss, lowering your total return below the income return.
6. It’s important to note that, even with the punishing tax erosion direct lending faces, this still leaves the asset class with an after-tax advantage of 80 bps−3.8% vs. the 3.0% from munis over the 21-year period.
7. Maintaining some allocation to equities in the tax-deferred account supports enhanced compounding, as suggested earlier.
Appendix
The analysis runs from Q1 2005–Q4 2025, a full 21 years. The indices include the Bloomberg Intermediate Municipal Bond Index, Bloomberg U.S. Aggregate Index, S&P500 for equities and the Cliffwater Direct Lending Index (CDLI). We pull total return, price return and income return for each. For net of fee analysis, the fees applied on municipal bonds (47 bps), U.S. Agg (37 bps) and equities (42 bps) represent the average asset-weighted fees on each asset class based on the Investment Company Institute (ICI) 2025 Handbook; the fees applied to the Cliffwater Index (193 bps) are based on the August 19, 2024 analysis by Cliffwater regarding their recommended fee calculations. The CDLI Index is gross of fees and includes no leverage. For net tax results, we use a capital gains tax of 23.8% and the highest category of ordinary income tax of 40.8%. Assets are modeled with a 5% quarterly turnover rate for the purpose of calculating capital gains taxes. We calculate and pay taxes on a quarterly basis, and we assume that tax liability is paid in the quarter it has occurred. Bonds and CDLI income are taxed at the federal top marginal ordinary income + NII rate of 40.8%, and equities income is taxed as qualified dividends + NII rate of 23.8%. Capital gains/losses arising from turnover or rebalancing are assumed to be long-term. Any unused capital loss is carried forward for future periods. Capital gains are taxed at the top marginal rate + NII of 23.8%. Cash arising from turnover and income is used to pay taxes at the end of the quarter, and the remaining amount is redeployed at the beginning of the next quarter in the target portfolio weights. Retirement accounts follow the same assumptions as Taxable accounts without taxes, which is equivalent to weighted pre-tax net-of-fees asset returns in a given quarter. When we compare Retirement accounts to Taxable accounts to capture the effect of the taxes at withdrawal, we withdraw the full amount and tax it at a 20% rate (presuming a lower effective tax rate in Retirement accounts). When we show allocations of 50% Taxable/50% Retirement, we do not rebalance between Retirement and Taxable accounts. We purchase 50% in the beginning in each account and let the two accounts proceed independently, subject to their own internal allocations; therefore, actual allocation will tend to drift slightly over the period. The CDLI, over the period, has produced both income and net capital losses; therefore, total return is lower than income return. We subtract fees of 1.93% from the income return. In our model, the net-of-fee annualized income return is approximately 8.8%, the annualized price return is -1.3% and the total pre-tax return is 7.5%. We pay taxes on 8.8% at a 40.8% ordinary income rate, which amounts to roughly 3.6% in taxes, which represents the absolute tax drag on direct lending. To find the relative tax drag, we divide absolute tax drag by pre-tax returns, resulting in a 48% relative tax drag, higher than the 40.8% ordinary income rate used throughout. Direct lending over the period suffers a 1.3% loss on price return, but realized capital losses do not offset ordinary income.
Disclaimer
In this document, the terms “Golub Capital” and “Firm” and, in responses to questions that ask about the management company, general partner, or variants thereof, the terms “Management Company” and “General Partner” refer, collectively, to the activities and operations of Golub Capital LLC, GC Advisors LLC (“GC Advisors”), GC OPAL Advisors LLC (“GC OPAL Advisors”, and together with GC Advisors, the “Registered Advisers”), and their respective affiliates or associated investment funds. Certain affiliated advisers are included as relying advisers (“Relying Advisers”) under GC OPAL Advisors’ umbrella registration, as described in its Form ADV. The terms “Investment Manager” or the “Advisers” may refer to GC Advisors, GC OPAL Advisors (collectively the “Registered Advisers”) or any of the Relying Advisers. For additional information about the registered Advisers and the Relying Advisers, please refer to each of the Registered Advisers’ Form ADV Part 1 and 2A on file with the SEC. Certain references to Golub Capital relating to its investment management business may include activities other than the activities of the Advisers, or may include the activities of other Golub Capital affiliates in addition to the activities of the Advisers. This document may summarize certain terms of a potential investment for informational purposes only. In the case of conflict between this document and the organizational documents of any investment, the organizational documents shall govern. Information is current as of the stated date and may change materially in the future. Golub Capital undertakes no duty to update any information herein. Golub Capital makes no representation or warranty, express or implied, as to the accuracy or completeness of the information herein.
Views expressed represent Golub Capital’s current internal viewpoints and are based on Golub Capital’s views of the current market environment, which is subject to change. Certain information contained in these materials discusses general market activity, industry or sector trends or other broad-based economic, market or political conditions and should not be construed as investment advice. There can be no assurance that any of the views or trends described herein will continue or will not reverse. Forecasts, estimates and certain information contained herein are based upon proprietary and other research and should not be interpreted as investment advice, as an offer or solicitation, nor as the purchase or sale of any financial instrument. Forecasts and estimates have certain inherent limitations, and unlike an actual performance record, do not reflect actual trading, liquidity constraints, fees, and/or other costs. In addition, references to future results should not be construed as an estimate or promise of results that a client portfolio may achieve. Past events and trends do not imply, predict or guarantee, and are not necessarily indicative of, future events or results. Private credit involves an investment in non-publicly traded securities which may be subject to illiquidity risk. Portfolios that invest in private credit may be leveraged and may engage in speculative investment practices that increase the risk of investment loss.
This presentation has been distributed for informational purposes only, and does not constitute investment advice or the offer to sell or a solicitation to buy any security. This presentation incorporates information provided by third-party sources that are believed to be reliable, but the information has not been verified independently by Golub Capital. Golub Capital makes no warranty or representation as to the accuracy or completeness of such third-party information. No part of this material may be reproduced in any form, or referred to in any other publication, without express written permission.
Past performance does not guarantee future results.
All information about the Firm contained in this document is presented as of July 2026, unless otherwise specified.
The Morningstar Indexes are the exclusive property of Morningstar, Inc. Morningstar, Inc., its affiliates and subsidiaries, its direct and indirect information providers and any other third party involved in, or related to, compiling, computing or creating any Morningstar Index (collectively, “Morningstar Parties”) do not guarantee the accuracy, completeness and/or timeliness of the Morningstar Indexes or any data included therein and shall have no liability for any errors, omissions, or interruptions therein. None of the Morningstar Parties make any representation or warranty, express or implied, as to the results to be obtained from the use of the Morningstar Indexes or any data included therein.
“Cliffwater,” “Cliffwater Direct Lending Index,” and “CDLI” are trademarks of Cliffwater LLC. The Cliffwater Direct Lending Indexes (the “Cliffwater Indexes”) and all information on the performance or characteristics thereof (“Cliffwater Index Data”) are owned exclusively by Cliffwater LLC, and are referenced herein under license. Neither Cliffwater nor any of its affiliates sponsor or endorse, or are affiliated with or otherwise connected to, Golub Capital, or any of its products or services. All Cliffwater Index Data is provided for informational purposes only, on an “as available” basis, without any warranty of any kind, whether express or implied. Cliffwater and its affiliates do not accept any liability whatsoever for any errors or omissions in the Cliffwater Indexes or Cliffwater Index Data, or arising from any use of the Cliffwater Indexes or Cliffwater Index Data, and no third party may rely on any Cliffwater Indexes or Cliffwater Index Data referenced in this report. No further distribution of Cliffwater Index Data is permitted without the express written consent of Cliffwater. Any reference to or use of the Cliffwater Index or Cliffwater Index Data is subject to the further notices and disclaimers set forth from time to time on Cliffwater’s website at https://www.cliffwaterdirectlendingindex.com/ disclosures.