
The case for maintaining a core direct lending allocation throughout the interest rate cycle.
With the Federal Reserve having already initiated several rate cuts, investors are now asking: How much further will rates fall—and how quickly?
All this raises a question for allocators to floating-rate direct lending strategies: Should they seek to trim their direct lending exposure in the expectation that declining rates will lead to lower returns?
Our experience suggests not: We believe the consistent, premium returns of direct lending strategies are compelling regardless of the prevailing interest rate regime.
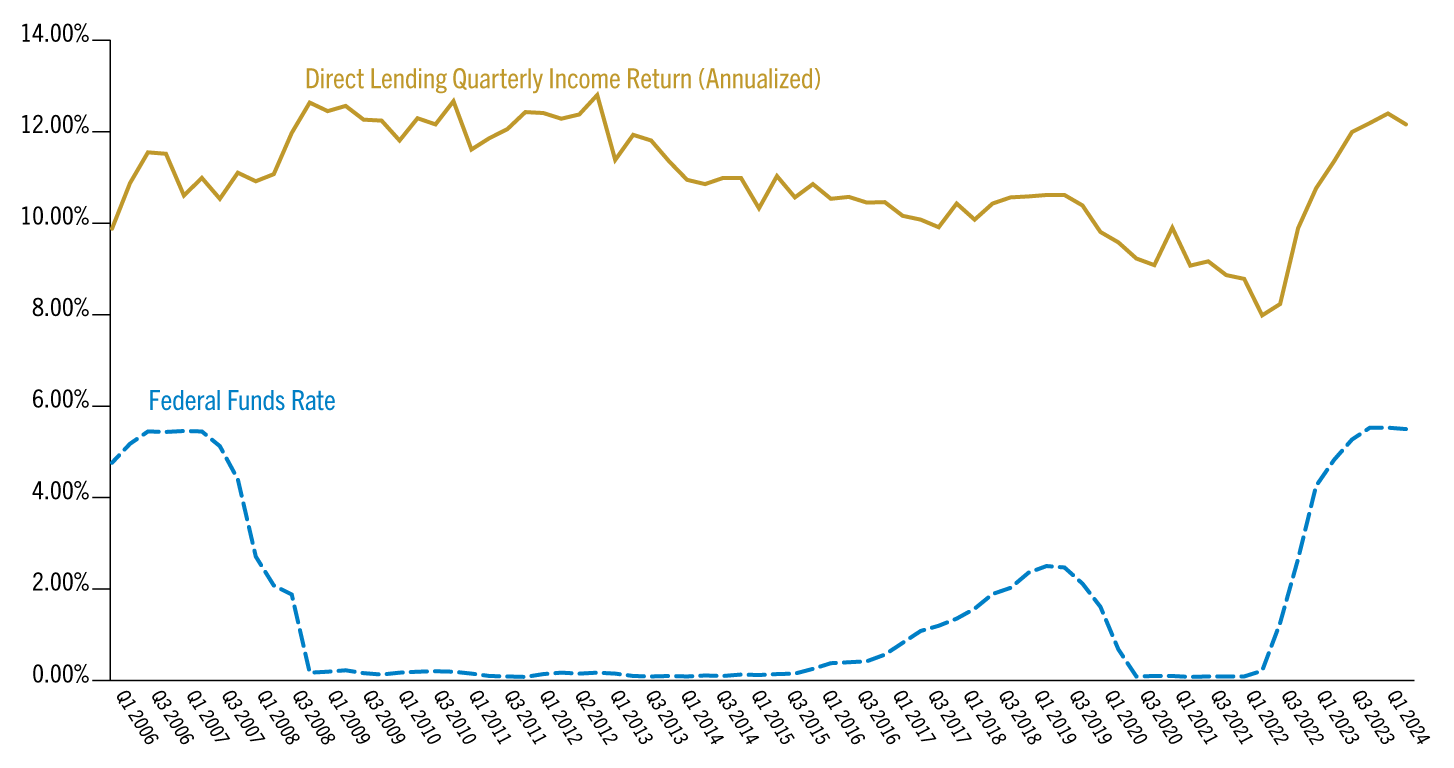
History suggests that there’s merit to making direct lending a core allocation. Exhibit 1 shows that quarterly income from direct lending has remained consistently strong, at between 9% and 12% annualized (between 2%-3% quarterly), even as Fed funds rates have fluctuated over the last two decades—including a long stretch near zero.
Direct Lending Quarterly Income vs. Effective Federal Funds Rate
Source: Cliffwater, Federal Reserve Bank of New York and Golub Capital Internal Analysis. Direct Lending is represented by the Cliffwater Direct Lending Index (“CDLI”). “Cliffwater,” “Cliffwater Direct Lending Index,” and “CDLI” are trademarks of Cliffwater LLC. The Cliffwater Direct Lending Indexes (the “Cliffwater Indexes”) and all information on the performance or characteristics thereof (“Cliffwater Index Data”) are owned exclusively by Cliffwater LLC, and are referenced herein under license. Neither Cliffwater nor any of its affiliates sponsor or endorse, or are affiliated with or otherwise connected to, Golub Capital, or any of its products or services. All Cliffwater Index Data is provided for informational purposes only, on an “as available” basis, without any warranty of any kind, whether express or implied.
Cliffwater and its affiliates do not accept any liability whatsoever for any errors or omissions in the Cliffwater Indexes or Cliffwater Index Data, or arising from any use of the Cliffwater Indexes or Cliffwater Index Data, and no third party may rely on any Cliffwater Indexes or Cliffwater Index Data referenced in this report. No further distribution of Cliffwater Index Data is permitted without the express written consent of Cliffwater.
Any reference to or use of the Cliffwater Index or Cliffwater Index Data is subject to the further notices and disclaimers set forth from time to time on Cliffwater’s website at https://www.cliffwaterdirectlendingindex.com/disclosures. The federal funds market consists of domestic unsecured borrowings in U.S. dollars by depository institutions from other depository institutions and certain other entities, primarily government-sponsored enterprises. The effective federal funds rate (EFFR) is calculated as a volume-weighted median of overnight federal funds transactions reported in the FR 2420 Report of Selected Money Market Rates.
From a total return perspective, duration-sensitive fixed income portfolios benefit in the short-term from unrealized gains associated with a decrease in rates.
Intermediate bond returns with over six years of duration, as measured by the Bloomberg U.S. Aggregate Bond Index, have a high degree of dependence on changes in benchmark Treasury rates. Over 70% of the quarterly return of “the Agg” is explained by 10-year yields, compared to just 30% for direct lending.¹ While there isn’t necessarily a tight link between the Fed funds rate and the 10-year Treasury yield, investors often look at their exposure to interest rates writ in broad terms.
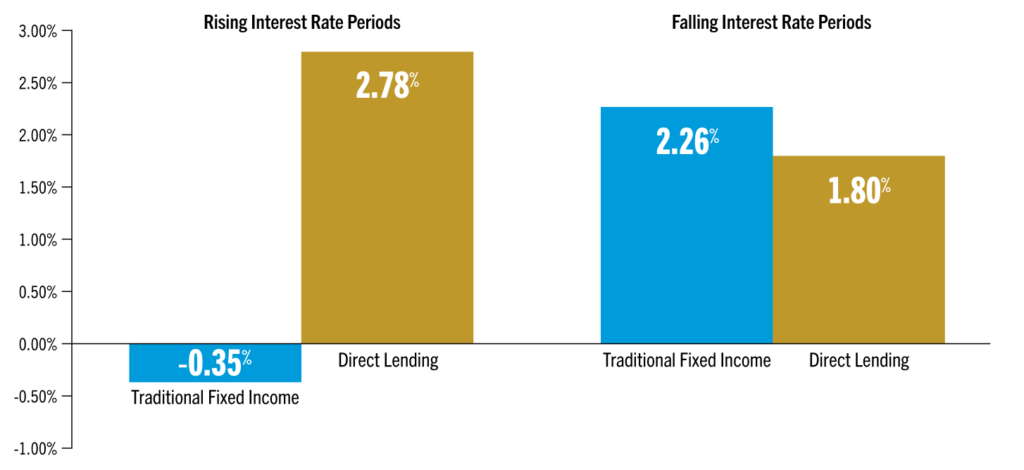
The good news for investors in direct lending strategies is that their total return “disadvantage” to traditional fixed income in periods of falling rates isn’t as significant as one might think.
Exhibit 2 shows that intermediate-duration bonds have historically outperformed direct lending from a total return perspective by about 46 bps during periods of falling 10-year rates.² But, consider the inverse: Direct lending has historically outperformed by about 311 bps during periods of rising 10-year rates.
Given how consistently consensus expectations about interest rates have been wrong during the last four years, we would argue that attempting to time the duration trade offers much more risk than potential reward.
Lower base rates also come with benefits for direct lending strategies that we believe mitigate return headwinds. Lower base rates reduce the cash interest expense of borrowers, which increases their margin for safety against operational setbacks. M&A activity tends to pick up when rates decline, which can create attractive deployment opportunities.
And for investors in leveraged direct lending strategies, a carefully matched portfolio of floating-rate assets with floating-rate liabilities can capture a consistent credit spread.
It may be tempting to view direct lending through a tactical lens, but we think investors should understand it as a strategic allocation.
Intermediate Bonds and Direct Lending Returns in Rising and Falling Rate Environments
Bloomberg, Cliffwater, Golub Capital Internal Analysis. Traditional Fixed Income represented by the Bloomberg Aggregate Bond Index Return. Direct Lending represented by the Cliffwater Direct Lending Index. Rising Interest Rate Periods, defined as when 10-Year yields rose quarter over quarter, saw an average change in the 10-Year yield of 0.33%. Falling Interest Rate Periods registered an average quarterly change in the 10-Year yield of -0.40%.
1. Stephen Nesbitt, Private Debt, Wiley, 2023, page 54
2. Ibid. Nesbitt, page 56
In this document, the terms “Golub Capital” and “Firm” (and, in responses to questions that ask about the management company, general partner or variants thereof, the terms “Management Company” and “General Partner”) refer, collectively, to the activities and operations of Golub Capital LLC, GC Advisors LLC (“GC Advisors”), GC OPAL Advisors LLC (“GC OPAL Advisors”) and their respective affiliates or associated investment funds. A number of investment advisers, such as GC Investment Management LLC (“GC Investment Management”), Golub Capital Liquid Credit Advisors, LLC (Management Series) and OPAL BSL LLC (Management Series) (collectively, the “Relying Advisers”) are registered in reliance upon GC OPAL Advisors’ registration. The terms “Investment Manager” or the “Advisers” may refer to GC Advisors, GC OPAL Advisors (collectively the “Registered Advisers”) or any of the Relying Advisers. For additional information about the Registered Advisers and the Relying Advisers, please refer to each of the Registered Advisers’ Form ADV Part 1 and 2A on file with the SEC. Certain references to Golub Capital relating to its investment management business may include activities other than the activities of the Advisers or may include the activities of other Golub Capital affiliates in addition to the activities of the Advisers. This document may summarize certain terms of a potential investment for informational purposes only. In the case of conflict between this document and the organizational documents of any investment, the organizational documents shall govern.
Information is current as of the stated date and may change materially in the future. Golub Capital undertakes no duty to update any information herein. Golub Capital makes no representation or warranty, express or implied, as to the accuracy or completeness of the information herein.
Views expressed represent Golub Capital’s current internal viewpoints and are based on Golub Capital’s views of the current market environment, which is subject to change. Certain information contained in these materials discusses general market activity, industry or sector trends or other broad-based economic, market or political conditions and should not be construed as investment advice. There can be no assurance that any of the views or trends described herein will continue or will not reverse. Forecasts, estimates and certain information contained herein are based upon proprietary and other research and should not be interpreted as investment advice, as an offer or solicitation, nor as the purchase or sale of any financial instrument. Forecasts and estimates have certain inherent limitations, and unlike an actual performance record, do not reflect actual trading, liquidity constraints, fees, and/or other costs. In addition, references to future results should not be construed as an estimate or promise of results that a client portfolio may achieve. Past events and trends do not imply, predict or guarantee, and are not necessarily indicative of, future events or results. Private credit involves an investment in non-publicly traded securities which may be subject to illiquidity risk. Portfolios that invest in private credit may be leveraged and may engage in speculative investment practices that increase the risk of investment loss.
Past performance does not guarantee future results.
All information about the Firm contained in this document is presented as of May 2025, unless otherwise specified.
“Cliffwater,” “Cliffwater Direct Lending Index,” and “CDLI” are trademarks of Cliffwater LLC. The Cliffwater Direct Lending Indexes (the “Cliffwater Indexes”) and all information on the performance or characteristics thereof (“Cliffwater Index Data”) are owned exclusively by Cliffwater LLC, and are referenced herein under license. Neither Cliffwater nor any of its affiliates sponsor or endorse, or are affiliated with or otherwise connected to, Golub Capital, or any of its products or services. All Cliffwater Index Data is provided for informational purposes only, on an “as available” basis, without any warranty of any kind, whether express or implied. Cliffwater and its affiliates do not accept any liability whatsoever for any errors or omissions in the Cliffwater Indexes or Cliffwater Index Data, or arising from any use of the Cliffwater Indexes or Cliffwater Index Data, and no third party may rely on any Cliffwater Indexes or Cliffwater Index Data referenced in this report. No further distribution of Cliffwater Index Data is permitted without the express written consent of Cliffwater. Any reference to or use of the Cliffwater Index or Cliffwater Index Data is subject to the further notices and disclaimers set forth from time to time on Cliffwater’s website.
"*" indicates required fields

Dispersion & Persistence of Manager Performance in Direct Lending
Learn