
It’s no surprise some investors struggle to differentiate among managers in the private credit market today. We’ve seen a steady flow of new direct lending funds enter the market, with nearly half of all managers in the category today representing funds newly minted over the last five years (Exhibit 1).
One telling statistic leaps out: During 2023, one new direct lending manager entered the market approximately every five days.
Number of New Managers Entering Direct Lending
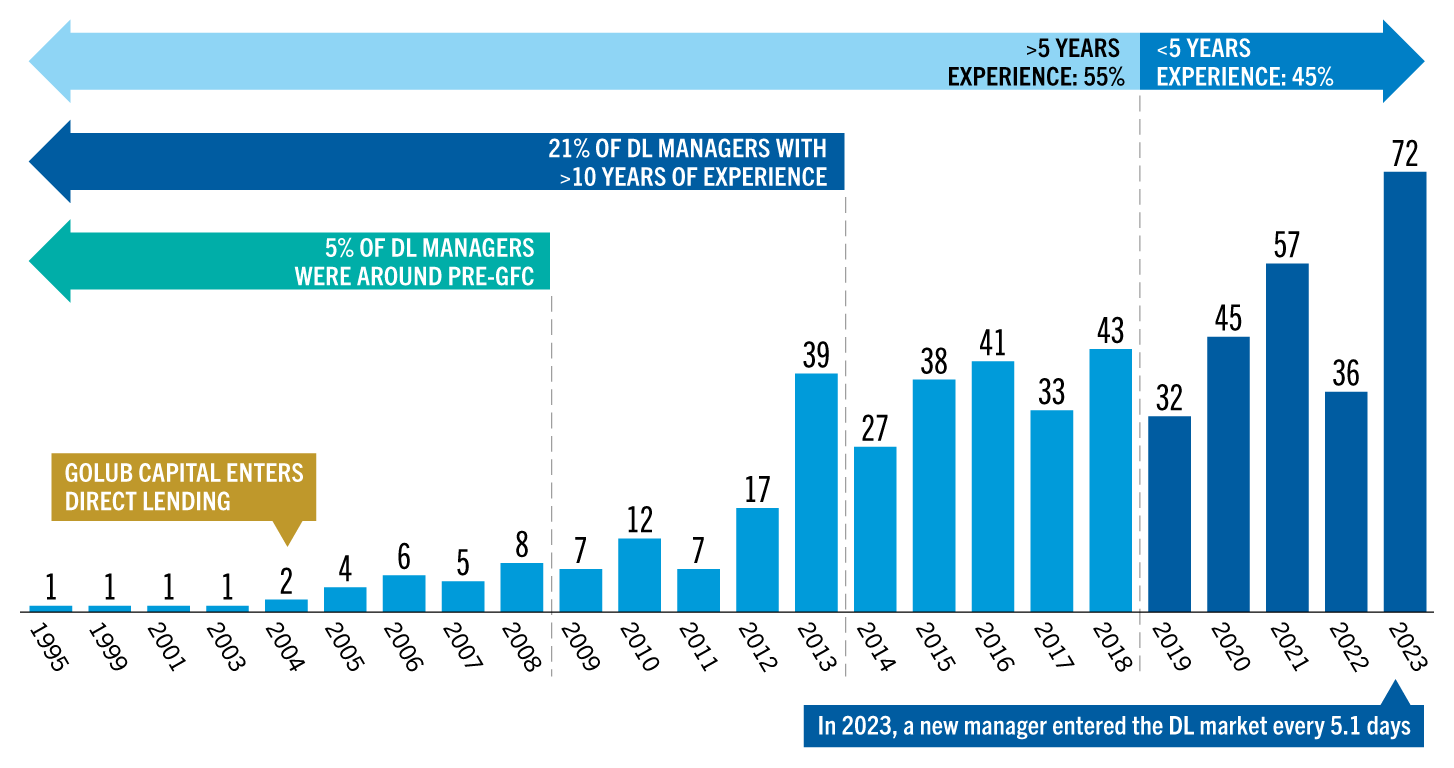
Source: Golub Capital internal analysis and Preqin. Utilizes Preqin’s database of first-time direct lending funds launched by an asset manager globally. The dataset includes 535 first-time direct lending funds launched from 1995-2023. As of February 1, 2025.
Amid such rapid expansion, we think manager selection has gotten more difficult. Not only has the number of managers risen exponentially, but we believe the vast majority are relatively untested: Only 21% of managers have more than 10 years of experience. And just 30 individual managers today, out of hundreds, were in existence during the global financial crisis from 2007 to 2009.
How do you appraise the untested? The volume of new direct lending names has led some investors to see the entire direct lending space as a “beta” play, where all managers—and their returns—look more or less the same.
We beg to differ.
Benjamin Graham once said that fixed income investing was a “negative art,” where performance depends more on what you keep out of the portfolio (that is, losses) than what you put into it. We believe this applies well to direct lending.
When you consider the main drivers of manager performance in direct lending, a number of factors stand out. We believe sourcing the best deals from high-quality sponsor-partners is key, as is expert “credit-first” underwriting and strong loan documentation. But managing through unforeseen turbulence in a borrower and avoiding value “leakage” is, in our view, the truest test of manager quality.
It turns out that historical loss rate is one of the most consequential factors in determining the level of return a direct lending fund will generate. This does not mean that other elements, such as the level of interest rates, spreads, leverage and other components, are NOT important performance drivers. These play a role, but our observation is that their impact declines in relevance if loss rates are not kept in check.
To illustrate this point, we have divided direct lending funds (as represented by public BDCs, where information is more readily available) into quartiles based on historic loss rates. In Exhibit 2, we calculate the average annualized return generated by funds in each quartile.
Managers who historically have been best at avoiding losses come out on top, with nearly 11% returns annually; those with the worst historical loss rate have annualized performance in the low single digits.
There is about a nine-percentage-point return difference or “dispersion” between these quartiles. We believe the connection is meaningful and that loss rates help drive the level of return.
Historical Loss Rate Compared to Total Return
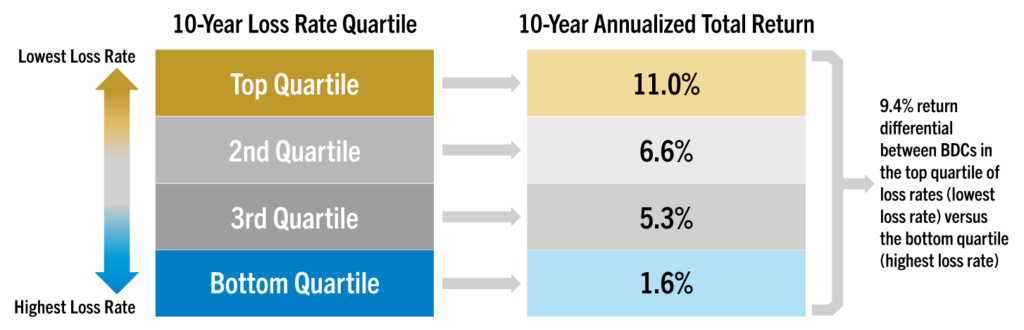
Source: Golub Capital internal analysis utilizing data provided by KBW Research. Utilizes KBW’s BDC research database of tracked return performance data covering the 10-year period from Q4 2014 through Q3 2024. Loss rate is calculated as the BDC’s cumulative difference between Net Investment Income per share and Net Income per share over the 10-year period divided by beginning period Net Asset Value (NAV) per share. BDC total return is calculated as the BDC’s change in NAV per share plus total dividends per share received over the period divided by beginning period NAV per share. Return and loss rate calculations cover the 10-year period of Q4 2014 through Q3 2024. The data set excludes internally managed BDCs and BDCs with 25% or more equity investment exposure. In total, three BDCs were excluded. The data set in the charts totals 24 BDCs. Past performance does not guarantee future results.
This gulf in performance across managers may recall some important differences between public and private market investments. We typically see a modest spread of one to two percentage points separating top and bottom quartile public credit managers1.
Private markets function differently: The percentage gap between the top and bottom performers widens more dramatically. So, choosing the right manager has real consequences, now and going forward.
We believe there’s another difference between public and private market funds: Evidence of continued outperformance by public market fund managers over any length of time is slight at best. We call this a lack of persistence. But private market managers tend to show a much higher degree of repeat performance, which holds for both good and less good managers.
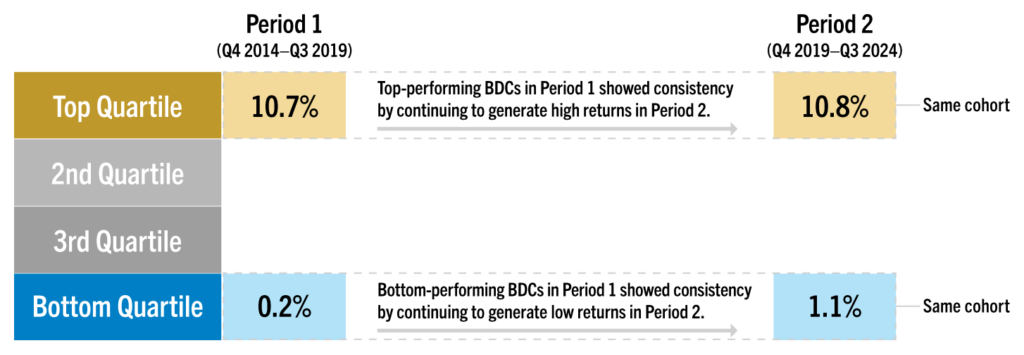
To illustrate this phenomenon in private credit, we studied direct lending returns over two sequential time periods, each five years in length. The first period ran from Q4 2014 to Q3 2019 and the second from Q4 2019 to Q3 2024.
We divided the managers from period one into four performance quartiles and then calculated return performance for the second period. Funds in the top quartile from Q4 2014 to Q3 2019 generated an 11% annualized return during the second period, from Q4 2019 to Q3 2024.
Managers in the bottom quartile from period one generated a 1% annualized return during period two. Half of top-quartile managers in period one persisted in the same top-quartile group in period two. This persistence of performance was notable—and, we believe, not a coincidence.
Annualized 5-Year Total Return
If manager selection is important—if direct lending strategies aren’t all about market beta—then how do you find managers who achieve and sustain that alpha? We believe the long-term winners in this business have similar characteristics as the long-term winners in any other business—they have enduring competitive advantages.
The power of competitive advantage is the ability to deliver consistent, premium returns to investors. We believe that return history should be evident in a track record that is consistent across different vintages, time periods, and market environments.
This level of performance in direct lending, we believe, will only be sustained by a firm with enduring competitive advantages—extensive partnerships across the sponsor community, strong origination and underwriting teams, along with expertise in restructuring and workouts. We observe that these are the characteristics that impact manager dispersion and can deliver high performance alpha over time.
In this document, the terms “Golub Capital” and “Firm” (and, in responses to questions that ask about the management company, general partner or variants thereof, the terms “Management Company” and “General Partner”) refer, collectively, to the activities and operations of Golub Capital LLC, GC Advisors LLC (“GC Advisors”), GC OPAL Advisors LLC (“GC OPAL Advisors”) and their respective affiliates or associated investment funds. A number of investment advisers, such as GC Investment Management LLC (“GC Investment Management”), Golub Capital Liquid Credit Advisors, LLC (Management Series) and OPAL BSL LLC (Management Series) (collectively, the “Relying Advisers”) are registered in reliance upon GC OPAL Advisors’ registration. The terms “Investment Manager” or the “Advisers” may refer to GC Advisors, GC OPAL Advisors (collectively the “Registered Advisers”) or any of the Relying Advisers. For additional information about the Registered Advisers and the Relying Advisers, please refer to each of the Registered Advisers’ Form ADV Part 1 and 2A on file with the SEC. Certain references to Golub Capital relating to its investment management business may include activities other than the activities of the Advisers or may include the activities of other Golub Capital affiliates in addition to the activities of the Advisers. This document may summarize certain terms of a potential investment for informational purposes only. In the case of conflict between this document and the organizational documents of any investment, the organizational documents shall govern.
Information is current as of the stated date and may change materially in the future. Golub Capital undertakes no duty to update any information herein. Golub Capital makes no representation or warranty, express or implied, as to the accuracy or completeness of the information herein.
Views expressed represent Golub Capital’s current internal viewpoints and are based on Golub Capital’s views of the current market environment, which is subject to change. Certain information contained in these materials discusses general market activity, industry or sector trends or other broad-based economic, market or political conditions and should not be construed as investment advice. There can be no assurance that any of the views or trends described herein will continue or will not reverse. Forecasts, estimates and certain information contained herein are based upon proprietary and other research and should not be interpreted as investment advice, as an offer or solicitation, nor as the purchase or sale of any financial instrument. Forecasts and estimates have certain inherent limitations, and unlike an actual performance record, do not reflect actual trading, liquidity constraints, fees, and/or other costs. In addition, references to future results should not be construed as an estimate or promise of results that a client portfolio may achieve. Past events and trends do not imply, predict or guarantee, and are not necessarily indicative of, future events or results. Private credit involves an investment in non-publicly traded securities which may be subject to illiquidity risk. Portfolios that invest in private credit may be leveraged and may engage in speculative investment practices that increase the risk of investment loss.
This presentation has been distributed for informational purposes only, and does not constitute investment advice or the offer to sell or a solicitation to buy any security. This presentation incorporates information provided by third-party sources that are believed to be reliable, but the information has not been verified independently by Golub Capital. Golub Capital makes no warranty or representation as to the accuracy or completeness of such third-party information. No part of this material may be reproduced in any form, or referred to in any other publication, without express written permission.
Past performance does not guarantee future results.
All information about the Firm contained in this document is presented as of January 2026, unless otherwise specified.
The Morningstar Indexes are the exclusive property of Morningstar, Inc. Morningstar, Inc., its affiliates and subsidiaries, its direct and indirect information providers and any other third party involved in, or related to, compiling, computing or creating any Morningstar Index (collectively, “Morningstar Parties”) do not guarantee the accuracy, completeness and/or timeliness of the Morningstar Indexes or any data included therein and shall have no liability for any errors, omissions, or interruptions therein. None of the Morningstar Parties make any representation or warranty, express or implied, as to the results to be obtained from the use of the Morningstar Indexes or any data included therein.
“Cliffwater,” “Cliffwater Direct Lending Index,” and “CDLI” are trademarks of Cliffwater LLC. The Cliffwater Direct Lending Indexes (the “Cliffwater Indexes”) and all information on the performance or characteristics thereof (“Cliffwater Index Data”) are owned exclusively by Cliffwater LLC, and are referenced herein under license. Neither Cliffwater nor any of its affiliates sponsor or endorse, or are affiliated with or otherwise connected to, Golub Capital, or any of its products or services. All Cliffwater Index Data is provided for informational purposes only, on an “as available” basis, without any warranty of any kind, whether express or implied. Cliffwater and its affiliates do not accept any liability whatsoever for any errors or omissions in the Cliffwater Indexes or Cliffwater Index Data, or arising from any use of the Cliffwater Indexes or Cliffwater Index Data, and no third party may rely on any Cliffwater Indexes or Cliffwater Index Data referenced in this report. No further distribution of Cliffwater Index Data is permitted without the express written consent of Cliffwater. Any reference to or use of the Cliffwater Index or Cliffwater Index Data is subject to the further notices and disclaimers set forth from time to time on Cliffwater’s website.
"*" indicates required fields
